2021-11-22 Compatible with #RM8
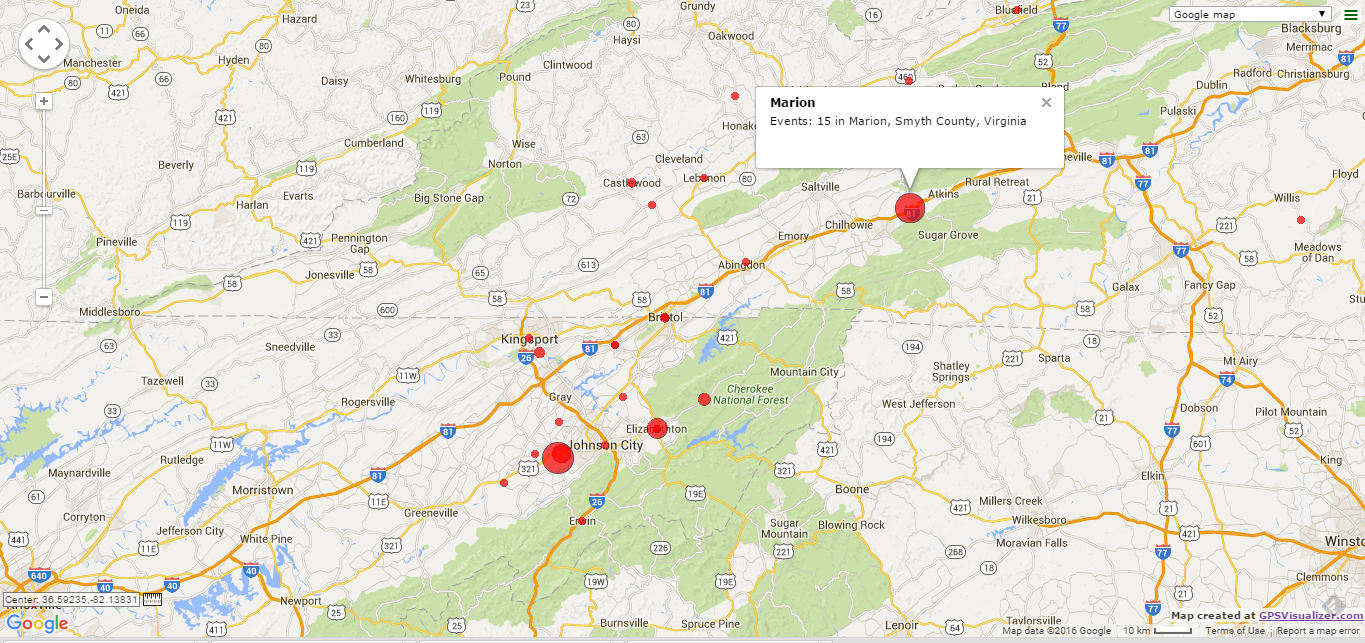
An earlier script, Places – Frequency of Use, produced a result set that counted the number of events in each Place in a RootsMagic database. This script builds on that query to generate a comma-delimited data set suitable for uploading to GPSVisualizer.com to generate a map with circle markers that are proportional in size to the number of events.
 |
| Example of a proportional symbol map generated from data extracted by Place_Frequency_GPSVisualizer. |
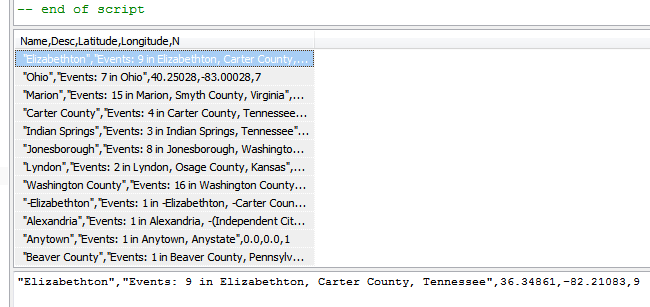
The script produces a result set similar to the screenshot below from SQLiteSpy. 
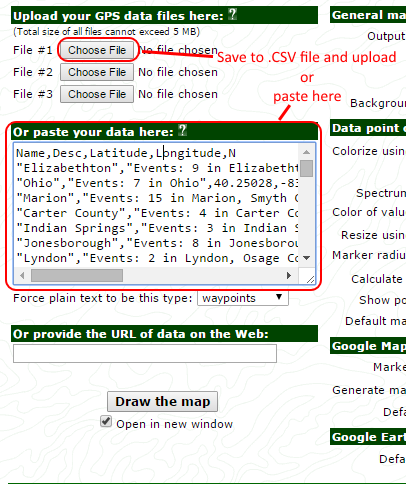
Select any row, then Ctrl-A to select all and Ctrl-C to copy all selected to the Windows Clipboard. You can choose to paste directly into the GPSVisualizer form or into a text editor (NotePad) and save it to a file with the .csv extension for upload and reuse.

Place_Frequency_GPSVisualizer.sql