If you have followed the guides to enable interrogation of the RootsMagic SQLite database via the Microsoft Access engine (MS Access Engine and MS Access Engine – Event Query and MS Access Engine – Using EXCEL) then you will also be able to use the Pivot Table feature of EXCEL to analayse your genealogy data.
The Pivot Table feature in EXCEL is one of the most useful tools availale to quickly sort and summarise data in any database. This is a quick guide to show how easy it is to look at the RM data using the Access Queries that we set up in the earlier posts.
Firstly – fire up Excel (I am using Excel 2007 here – but the Pivot Table feature has existed in earlier versions of EXCEL for some time). Then open your Access databse (which in reality is just a collection of Quries that point to the real data in your live RM database).
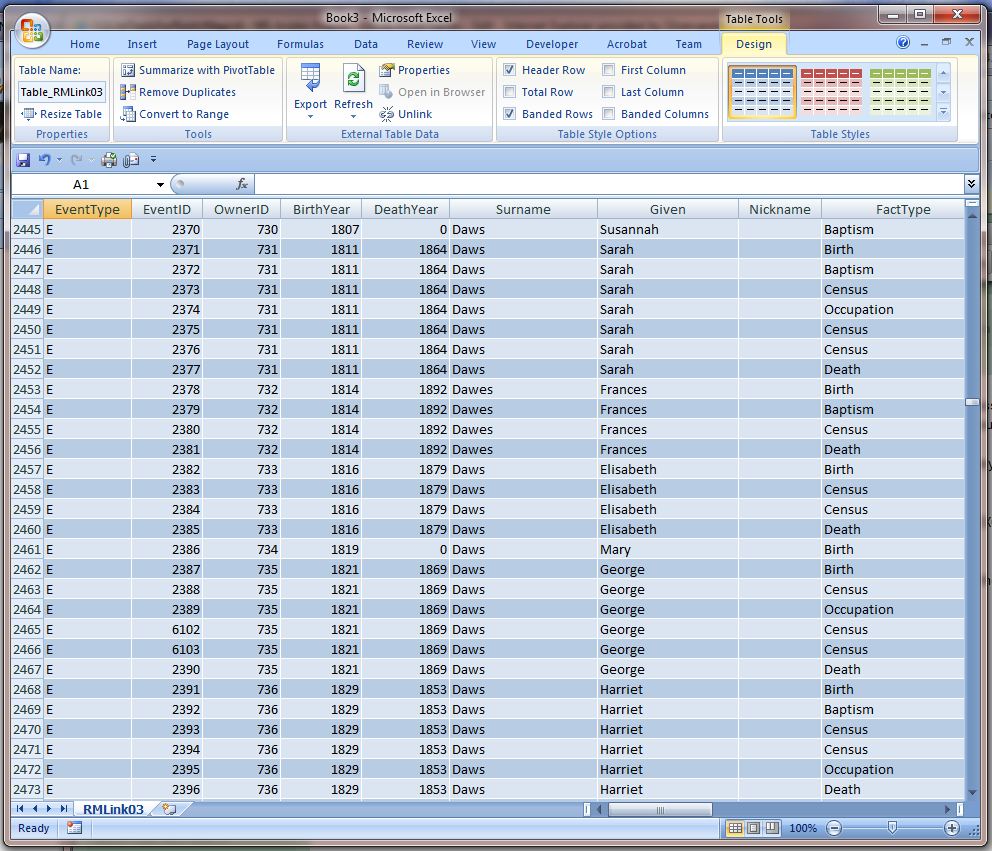
Select the MVSALLEventsCombinedQuery (or the equivalent if you named your tables differently). You should then see the usual screen of data, semething like this….
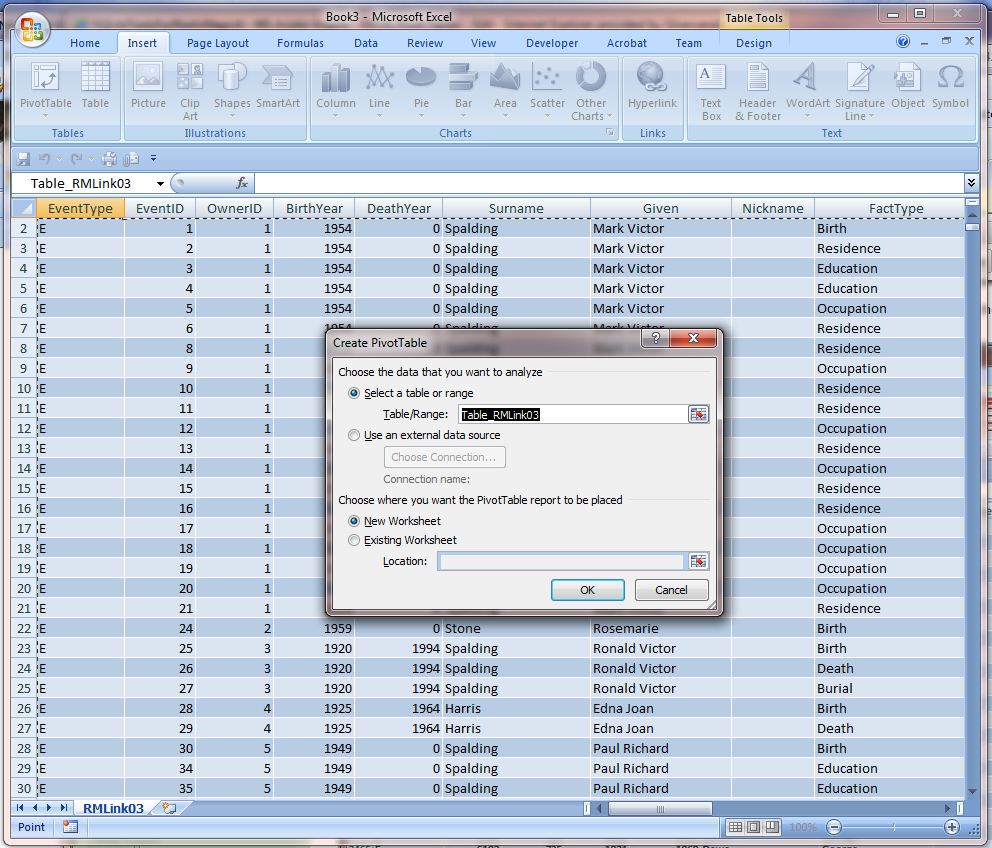
Click the ‘Insert’ tab at the top of the screen and then click the ‘Pivot Table’ button on the ribbon. You should be presented with a screen like this:
Excel will have automatically selected the full range of the spreadsheet and suggested creating a new Worksheet for the Pivot Table. Unless you have any reason to do anything special – just accept these options by clicking the OK button. You will now get a screen like this:.
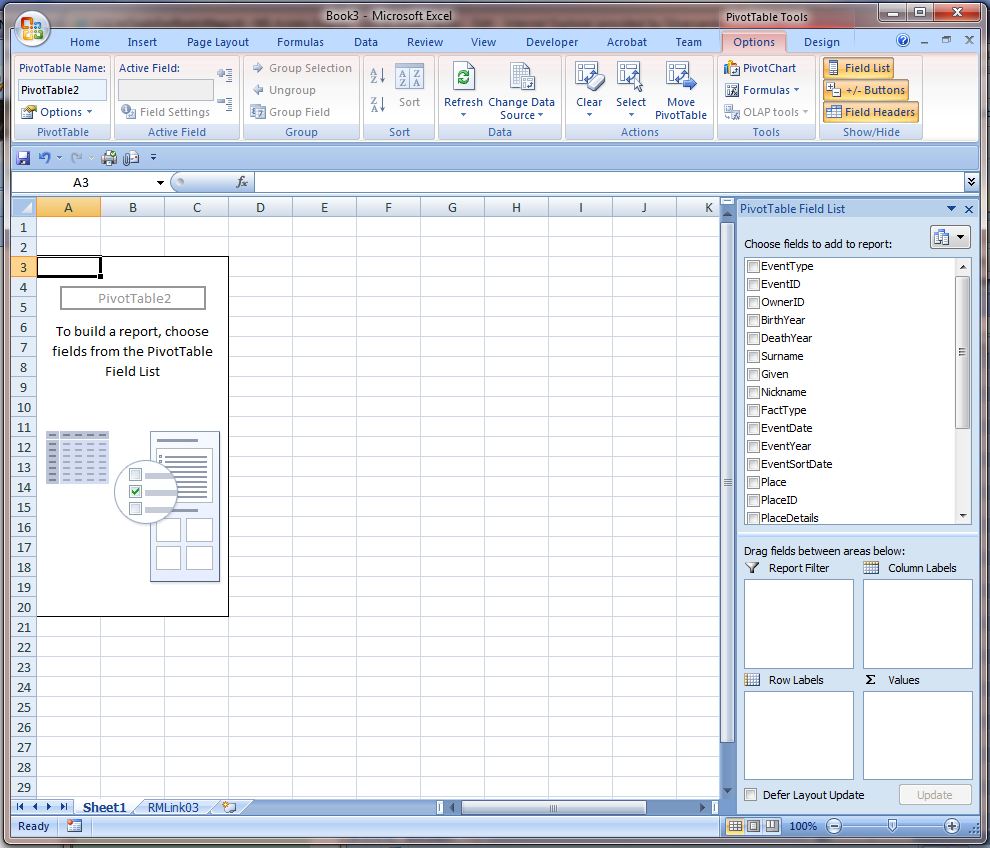
For this example complete the following steps:
Select and drag the “FactType” field into the Report Filter box.
Select and drag the Surname” field into the Column Lables box.
Select and drag the “Event Year” field into theRow Lables box.
Select and drag the “Event Type” field into the Values box.
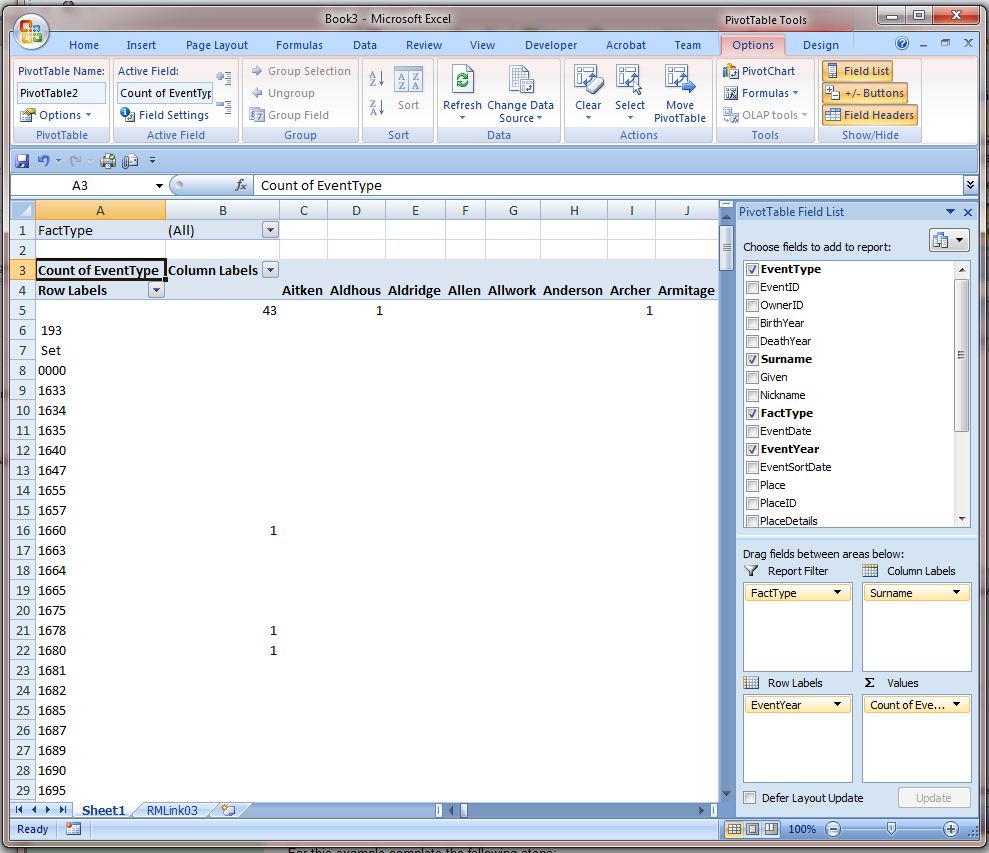
Your screen display will now look something like this: (but with different dates and surnames according to the contents of your own database) ::
What this is showing is a count of Events recorded in the RM database for each year for each surname. Unless your RM database is very very small this will be a very large grid. To make it meaningful we need to put in some selection criteria.
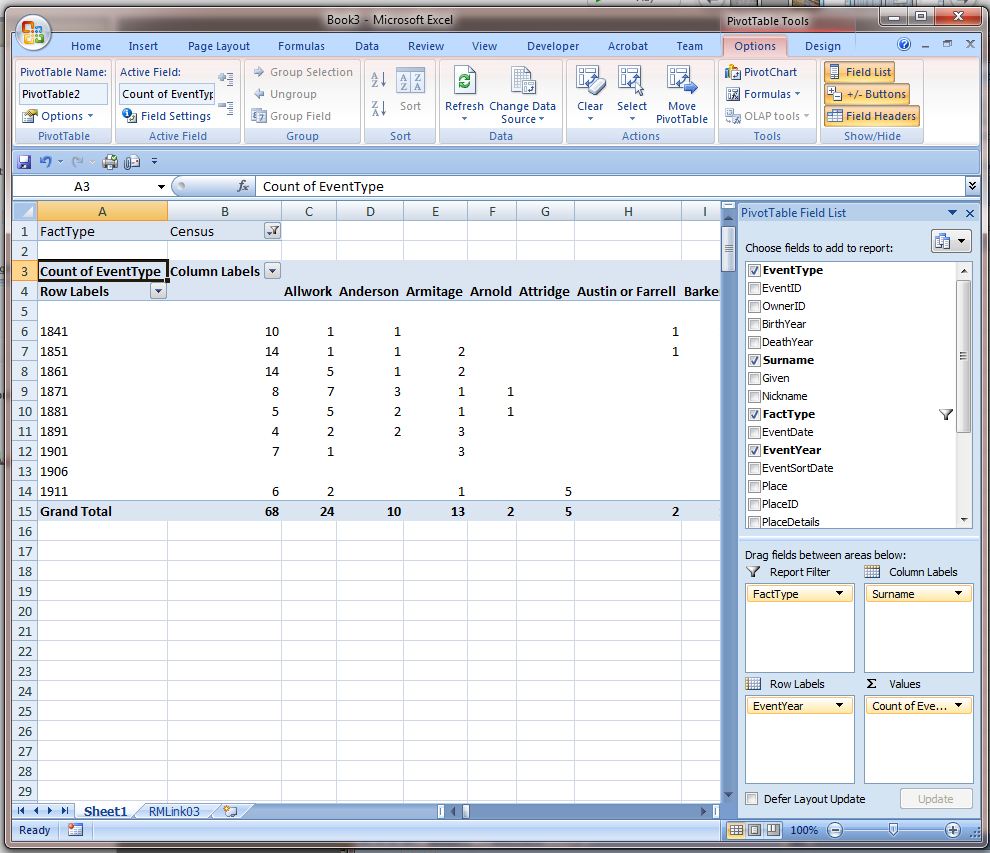
Click on “Fact Type” in the Pivot Table Field List area. you will see a list of the Fact Types being reported. Click on “Census” and press the OK button. The Pivot Table will be quickly redisplayed showing a summary of Census types only. This will also mean that the Event Years column on the left will be reduced to years in which you have recorded census events (probably 1841, 1851, 1861 etc). You will still have a large number of columns running across the screen – with entries for all the Surnames on your database for which Census events are recorded. My display lookes like this:
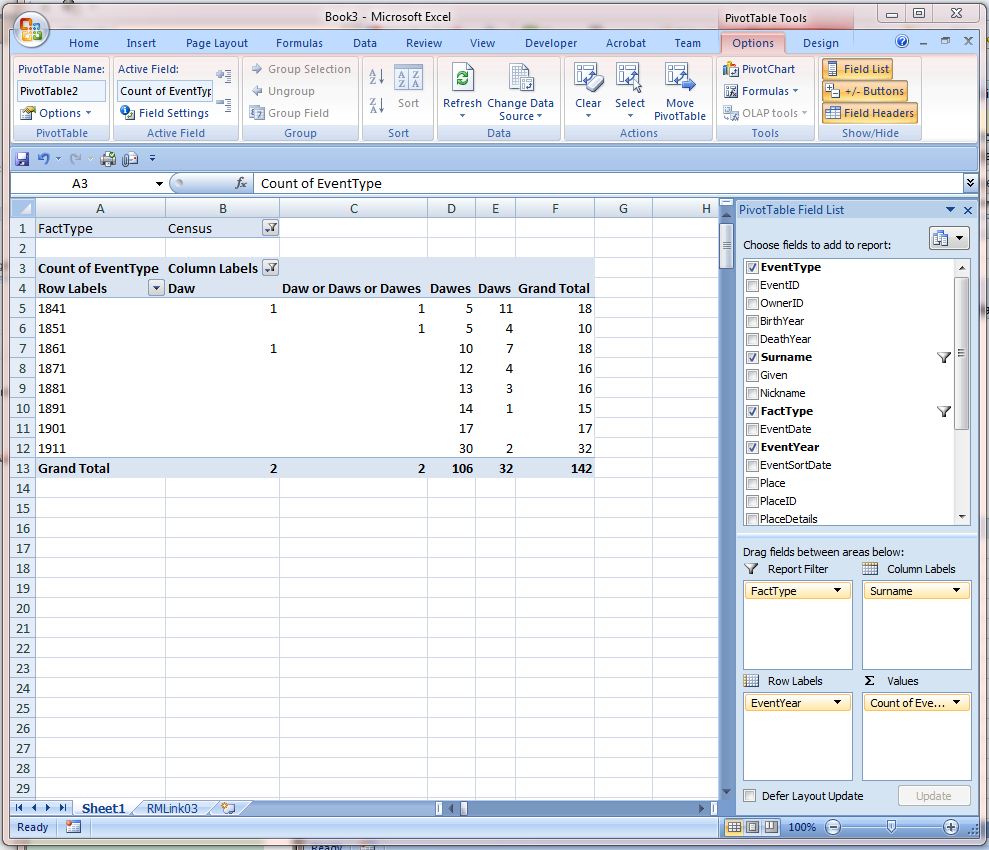
Now click on the Surname in the PivotTable Field list and DE-select the “Select All” box at the top of the list of Surnames. Then scroll down and select one or more Surnames that you want to analyse (I am going to pick a couple of variants of the Dawes name in my example, from my database). When you have finished updating the list press the OK button and you will see a new display analysing the data you have selected. Mine looks like this:
As you can see I now have an analysis of the number of occurences of Census events recorded in my database for the specific variants of Surname that I have selected and showing the years they were recorded in.
It is important to remember where the data came from though. I am analysing the MVSALLEventsCombinedQuery. This means that I am listing all the events whether they were recorded against the individual or where I have SHARED them in RootsMagic.
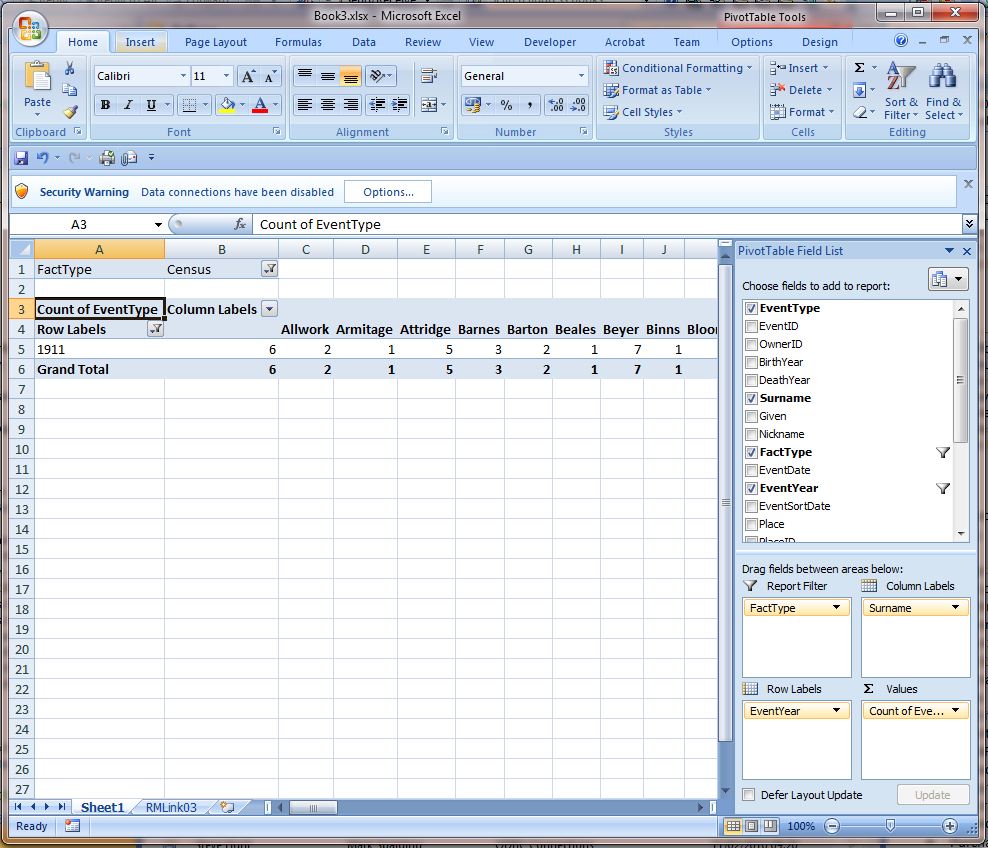
Here is another example where I have altered the selection criteria – I am now only selecting those items with an Event year of 1911 and an Event Type of Census and I have removed the Surname selection so that ALL surnames are being reported. This gives me a grid showing the counts for all the Surnames for which I have 1911 Census records entered:
The PivotTable tool is a very powerful analysis feature. It is worth spending a little while playing with the selectiong and reporting features and this is easily done by draggin fields into and out off the report. You can also filter on the contents of any field, whether it is being rpeorted on or not. You can place multiple fields in any of the Reprot Filter, Column Labels, Row Labels or Values boxes to create more complex summaries.
You can Print your Pivot Table analyses using hte usual EXCEL print features.
You can save your PivotTable workbook for later use. When you re-open it at a later date it will show the data as it was saved. However, if you select the Tab showing all the items listed in grid view (ie the original grid that resulted form opening the Access databse and selecting the MVSALLEventsCombinedQuery and the click the Data tab and click the Refresh All button on the ribbon Excel will go away and re-stablish the data link and refresh the data on the screen, including your Pivot Table with the current contents of you live RM database.
You can select the PivotTable report grid and produce Excel spreadsheets in the usual way – these too will by updated when you Refresh data on saved reports. For example we can add one to the Dawes analysis I have just designed :
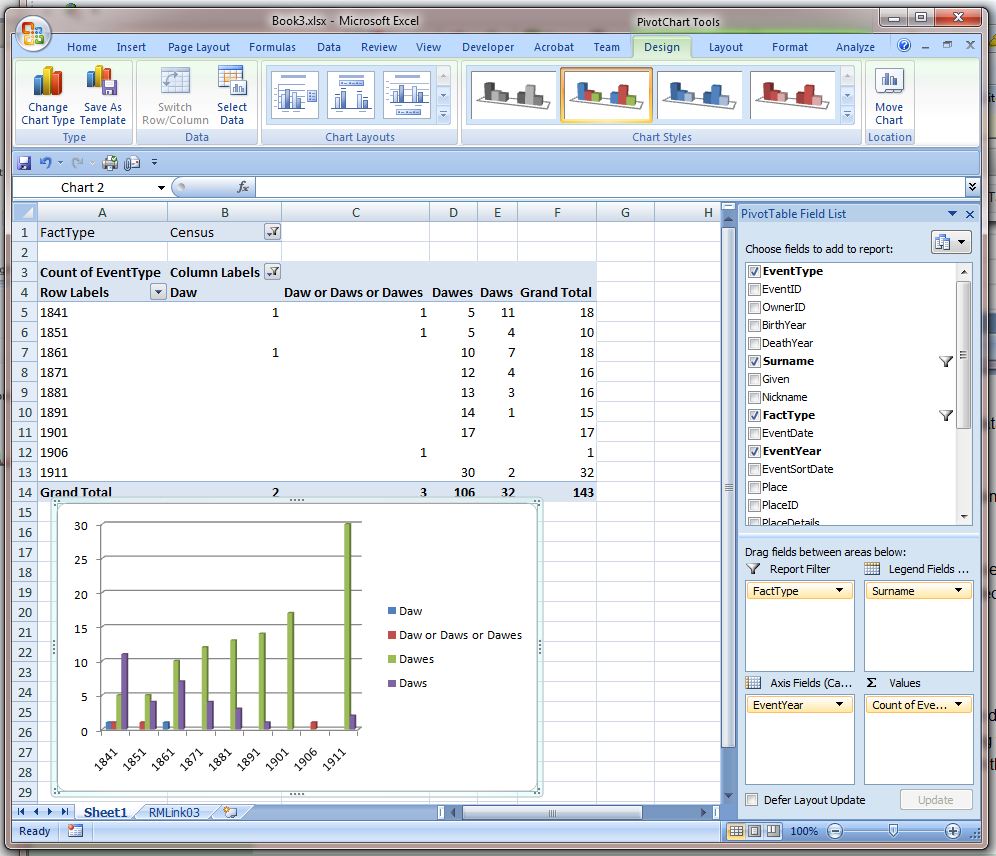
PS – there is also the Pivot Chart function which can be selected instead of creating a Pivot Table. This is another way of, directly, creating graphics from complex data using identical drag/drop and selection functions. You may want to experiment with this feature if you are more into graphs than grids.
END.
Prev: MS Access Engine | MS Access Engine – Event Query | MS Access Engine – Using Excel Next: MS Access Engine – The BLOB Fields
- Home
- A Query for a To Do List in a Grid Format
- Adding Virtual Columns to an RM4 Table
- MS Access Engine
- MS Access Engine – Event Query
- MS Access Engine – EXCEL Pivot Tables
- MS Access Engine – The BLOB Fields
- MS Access Engine – Using EXCEL
- MS Access, SQLite, and Don Quixote
- Questions about RM4 Tables
- Scope of Names in Queries and Sub-queries
romermb
17 February 2010 02:17:11
Pivot tables have definitely come in very useful in the past for me. This feature may be referred to as DataPilot in the free OpenOffice Calc application, although I’ve not used it there.
Although I do have Excel here at home, I don’t have Access and haven’t used it for several years. If I remember correctly, you had the option to create a Crosstab query in Access, which worked similarly to a PivotTable in Excel. The results could then be brought into Excel and massaged further there, if necessary. Depending on your needs for a particular bit of information and its presentation, producing it in Excel or in Access might be most efficient.
With the number of row (and column) limitations of Excel under versions prior to Excel 2007, sometimes you’d have no choice but to use Access. However, Excel 2007 greatly expanded that capacity for a particular sheet within a workbook, so isn’t as much of an issue. Calc (part of OpenOffice 3.1.1, currently) hasn’t expanded its capacity, and I see no option to create a DataPilot-type query in Base. In fact, I don’t immediately see a way there to create a Make Table query, Append query, Update query, Delete query, etc, so it looks signficantly more limited than what I remember of Access. Fortunately, these four query types aren’t as necessary for working with the RM4 database, itself.